Schenectady Police Department
As bold as the spirit of New York, we are the NYCLU.
Donate
© 2024 New York
Civil Liberties Union
Civil Liberties Union
The New York State Police (NYSP) is the second largest police force in New York State, with over 4,700 uniformed police officers.1 The NYSP’s jurisdiction covers the entire state and is divided into 11 Troops and 191 stations. NYSP officers patrol New York’s highway system, but they also respond to 911 calls and conduct criminal investigations.
Until now, very little was known about how the department polices roadways across the state or what discipline officers receive when they abuse New Yorkers.
The NYCLU obtained tens of thousands of records about police misconduct investigations, disciplinary records, and use-of-force incidents from the NYSP after we submitted a Freedom of Information Law request. The records show that officers were investigated for nearly twenty thousand reported acts of misconduct and recorded over five thousand use-of-force incidents from 2000 to 2020.
An NYCLU analysis of the records makes clear that the NYSP does not usually hold officers accountable for misconduct. The department’s officers also engage in regular uses of force, including the use of tasers and pepper spray, often during non-criminal enforcement actions like traffic stops and during mental health crises.
The NYSP investigates its own misconduct allegations. As is often the case when departments are tasked with policing themselves, the NYSP verified misconduct allegations at very low rates when an officer was accused of misconduct involving a civilian, like unlawful searches, use-of -force, or discrimination. And even when misconduct was substantiated, only a fraction of verified misconduct investigations triggered serious disciplinary action. Most officers received a slap on the wrist.
Below you will find a detailed breakdown and analysis of the department’s misconduct and discipline data, as well as an analysis of NYSP officers’ use-of-force records. Finally, there are searchable databases containing the misconduct and disciplinary history of individual NYSP officers as well as officers’ use-of-force histories.
The NYCLU analyzed over 18,000 records detailing the New York State Police’s misconduct investigations and disciplinary outcomes from 2000 to 2020. The investigations include misconduct related to civilian-police interactions, like unlawful searches, and personnel violations that are internal to the department, like insubordination. Each “investigation” refers to an individual act of alleged misconduct, meaning multiple investigations may stem from a single “incident” where misconduct occurred. The analysis revealed the following:
The NYSP’s entire disciplinary investigative process is internal. This means that the department effectively gets to police itself. No outside entity is responsible for deciding if misconduct took place and, if so, what discipline an officer should face. All of these determinations are made by authorities internal to the NYPSP. As we have seen time after time in countless police departments across the country, when police are asked to police themselves, officers are rarely held accountable for misconduct. The NYSP is no exception.
Below are further details on the investigative process.
The Professional Standards Bureau (PSB) is a division of the NYSP that investigates allegations of misconduct by NYSP employees and decides whether misconduct occurred.1 Depending on the severity of the alleged misconduct, investigations may be conducted by a designee of the officer’s troop/division commander or by the PSB themselves. Misconduct investigations are determined to be “founded” when “the facts substantiate the specific allegation(s) made or other misconduct,” “unsubstantiated” when “insufficient facts exist to either prove or disprove the allegation(s) made, and “unfounded” in a case when “the facts [that] substantiate the allegation(s) made are false.” Investigations can also be “closed by investigation,” which means they are dismissed by the NYSP.
If an investigation is deemed to be founded, the troop Commander or the First Deputy Superintendent of the NYSP determines the disciplinary penalty. If administrative charges are warranted, an administrative hearing is conducted where a panel of three NYSP members submits investigation findings and determines the disciplinary penalty.
The misconduct records that the NYCLU received include summaries of misconduct investigations conducted by the PSB between 2000 and 2020 and the disciplinary penalties that were imposed in founded cases. Each summary is limited to a single phrase describing the alleged misconduct and the discipline imposed, respectively.
The records include information about 18,233 officer misconduct investigations that occurred between 2000 and 2020. Of the 18,233 investigations, 41 percent (7,476) were founded, 23 percent (4,282) were unsubstantiated, meaning that the PSB did not have enough evidence to determine if the act constituted a policy violation, 23 percent (4,167) were unfounded, and 12 percent (2,170) were “closed by investigation.”2
Investigations of alleged misconduct that appear to be against civilians were founded at very low rates.3 For example:
Officers found to have committed misconduct rarely received serious discipline. Of the 7,476 founded investigations, five percent of officers received no discipline, 52 percent received a slap on the wrist (reprimand, censure, or counseling), 16 percent lost vacation days, 13 percent were suspended without pay, 10 percent were placed on probation, one percent received a reduction in rank, two percent were terminated, and one percent received some other type of discipline.4
An analysis of over 5,000 records detailing NYSP use-of-force incidents from 2000 to 2020 reveals:
Our analysis shows 5,554 reported use-of-force incidents occurred between 2000 to 2020, an average of 264 per year.2 Records include 3,725 individual officers named in at least one use-of-force incident. The 393 officers who were named in five or more incidents were involved in nearly half of all use-of-force incidents. In other words, about 10 percent of the officers in the database were named in one out of every two use-of-force incidents. Most officers have only one or two incidents associated with their name.
Because the format of the use-of-force records changed significantly in 2017, the NYCLU analyzed the records from the two periods, 2000 to 2017 and 2018 to 2020, independently.
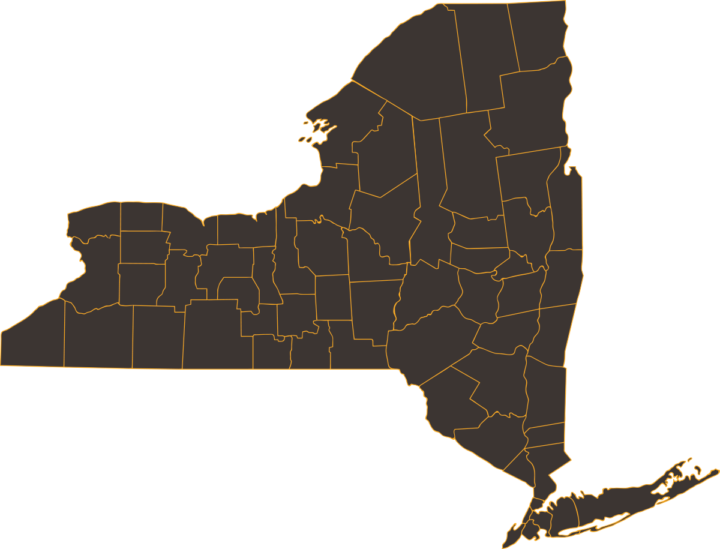
The records from 2000 to 2017 include information about 4,955 incidents that occurred between 2000 and 2017. Officers in Troop F, which operates in Rockland, Orange, Sullivan, Ulster, and Greene counties, engaged in more use-of-force incidents (756) than any other troop from 2000 to 2017, followed by Troop G (726), which operates in Albany, Schoharie, Rensselaer, Schenectady, Montgomery, Fulton, Saratoga, Washington, Warren, and Hamilton counties. Below is a map showing the use-of-force incidents by Troop from 2000 to 2017:
Officers operating in Saratoga, Warren, and Washington Counties, Troop G, Zone 2, engaged in more use-of-force incidents (339) than any other sub-area in the state, followed by officers in Rockland and Orange counties, Troop F, Zone 2 (324), and officers in Ulster and Greene Counties, Troop F, Zone 3, (309).
Nearly 45 percent of use-of-force incidents were categorized as “Physical Force – General,” a category that could include any number of discrete acts, like shoving a citizen or threatening the use of a taser or a firearm. Pepper spray and tasers were the next most common type of force used, accounting for 35 percent and 11 percent of use-of-force incidents, respectively.3 Below is a chart showing the frequency of incidents by force type:
Ten percent of use-of-force incidents arose from a mental health related response, and 12 percent came during incidents of alleged disorderly conduct. Of the 506 incidents that arose from a mental health related response, pepper spray was used in 184 incidents (36 percent), and tasers were used in 99 incidents (20 percent). Of the 1,606 use-of-force incidents that arose from a traffic stop, 513 (32 percent) included the use of pepper spray and 144 (nine percent) included the use of tasers.
An analysis of the records from 2018 to 2020 reveals that an additional 599 use-of-force incidents took place between 2018 and 2020.4 Of 599 use-of-force incidents, an officer brandished their weapon in 41 percent of incidents, used a taser in 44 percent of incidents, and used pepper spray in eight percent of incidents.
Of the 156 incidents that arose from a traffic stop, officers used tasers in 51 percent of incidents and brandished their weapons in 36 percent of incidents – extreme responses to traffic enforcement, which is commonly a non-criminal enforcement action. Officers used tasers in about 66 percent of the 86 use-of-force incidents that occurred during a “welfare check.”
The NYCLU requested much more data than the NYSP turned over. We continue to seek the full range of information that we originally sought, which would allow us to gain a better understanding of the way NYSP officers police our streets.
The records the NYSP turned over leave much to be desired. They are limited to several key pieces of information for each misconduct investigation and use-of-force incident, including the names of the officers who were involved in use-of-force incidents and the officers who were the subject of a “founded” misconduct investigation. However, the NYSP refuses to disclose the names of officers who were the subject of a misconduct investigation that was not founded by their Investigations Bureau. The NYCLU is suing the NYSP for the remaining names and the individual records themselves, which are being illegally withheld from the public.
The records that are a part of this analysis are the product of the NYSP’s internal records, so use-of-force incidents or acts of officer misconduct that are not reported to the NYSP or for whatever reason were not maintained by the NYSP will not be captured in the records.
From 2000-2017, there are 612 incidents where two types of force listed, as opposed to one. In those cases, for the purposes of summary, the more severe force was analyzed. For example, if an incident listed two types of force, one that was “physical force – general,” “struck by object,” “K9”, “Handcuff Injury,” or “Other,” and one that was “used taser,” “used pepper spray,” or “used weapon,” the use of taser, pepper spray, or weapon was analyzed and the less serious type of force was treated as incidental. If an officer used their “weapon” (firearm), that force value was prioritized over any other type of accompanying force type.
From 2000-2017, many cases listed two officers, a “primary” officer, and a “secondary” officer. In analyzing an officer’s incident history, the NYCLU summarized all incidents in which they were named, regardless of whether they were named as the primary or secondary officer. The troop assignment of the primary officer was used to match use-of-force incidents to Troops.
First and last name was used to group incidents by officer. Badge number was not used since there is evidence that badge numbers can be reassigned after retirement.
The analysis of force type and the context in which force arose required categorizing dozens of values into relatively fewer categories. Common sense was used to create these categories. Both the original values and the adopted categories are available in the raw data published by the NYCU.
If the force value read “Division weapon” or “Discharged firearm,” the NYCLU assumed the officer used their firearm.
This analysis was performed by Jesse Barber, edited by Simon McCormack with design and layout by Pooj Padmaraj.
1. https://ig.ny.gov/system/files/documents/2020/08/nyspdetf2245.030.2018-nyc.pdf
2. 138 records had a missing finding value or a value other than the four main categories.
3. The records include a description of the alleged misconduct in extremely broad terms, for example, “Unprofessional Conduct,” “Excessive Force,” or “Improper Police Action.” This limited the NYCLU’s ability to determine the nature of the alleged misconduct – i.e., whether it occurred during a civilian-officer incident or whether it was a personnel violation internal to the department. In the absence of more descriptive records, the NYCLU focused its analysis on key misconduct categories that likely involved civilians or were otherwise noteworthy, though it is likely that many more investigations involved civilian contact.
4. If multiple types of discipline were imposed in a single investigation, only the most severe discipline was considered for the purposed of this analysis. Many investigations, even those naming two distinct officers, may share a case number with other investigations, meaning that they occurred during the same “incident.”
5. Though the NYSP does not publicly define the term “welfare check,” it is commonly understood as referring to a non-criminal investigation into a civilian’s well-being.
6. In many incidents there were multiple officer names associated with the same incident.
7. For purposes of analysis, several type of force values were grouped together into eight categories for simplicity.
8. While the second batch of investigations is referred to as investigations occurring between 2018-2020, the period includes 42 records from 2017 as well.
9. The frequency at which officers brandished their weapons was not tracked before 2018.